Spreadsheet Sections
M1 Spreadsheet is split into tabs at the bottom of the workbook. Each tab owns one part of the portfolio workflow.
Watchlist
The watchlist is the database of assets you want to track. Add anything here before using it in the rest of the sheet.
To add a stock:
- Select the yellow ticker cell.
- Enter the ticker.
- Press enter or select another cell.
- Tap Add.
The sheet lists company name, market cap, share price, listing currency, daily change, distance above the 52-week low, and distance below the 52-week high.
Sectors
Use sectors to define the categories that make up your portfolio and the target weight for each category.
If you do not want sector-level weighting, create one sector with a 100% target weight and assign every asset to it.
Weights
Weights is where you define the target mix inside each sector. The sheet then calculates the absolute portfolio weight.
Example:
- Tech/Cloud is 21% of the portfolio.
- Apple is 60% inside Tech/Cloud.
- Microsoft is 40% inside Tech/Cloud.
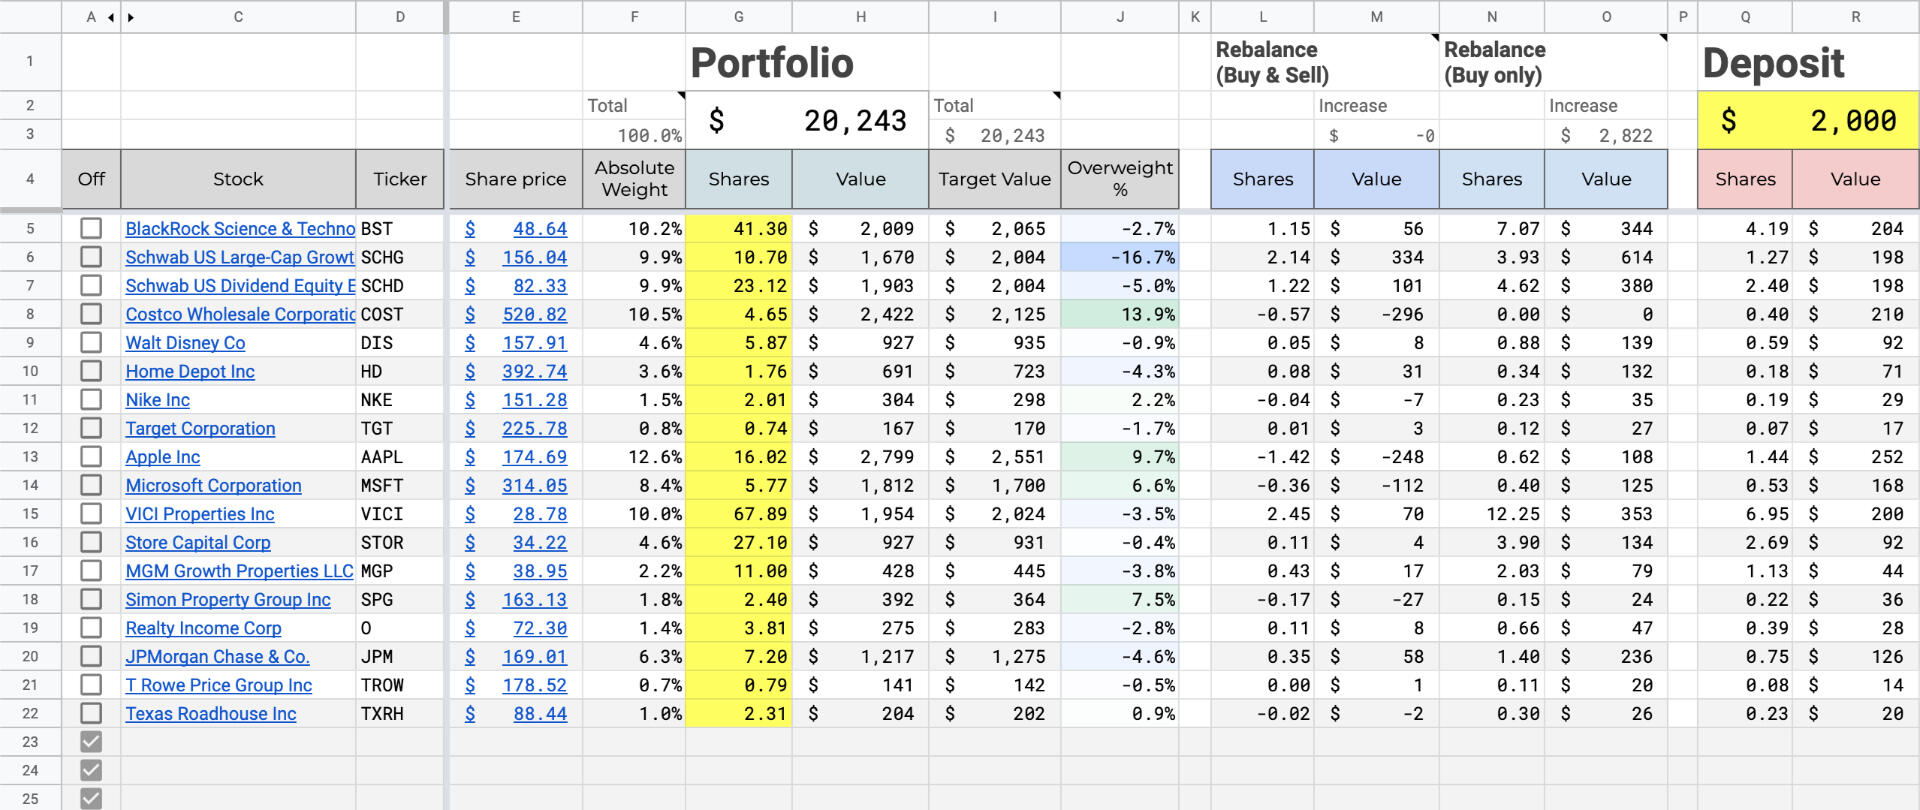
The absolute weights become 12.6% Apple and 8.4% Microsoft.
Portfolio
The Portfolio tab is where you enter shares owned and read the calculated results.
It has three main areas:
- Portfolio: current value, target value, and overweight percentage.
- Rebalance: buy-and-sell and buy-only rebalance amounts.
- Deposit: how to split a new deposit by target weight.
Rebalance
M1 Spreadsheet supports two rebalance modes:
- Buy and sell: Calculates what to buy or sell to return to target weights with no net change to portfolio value.
- Buy only: Calculates what to add to underweight assets without selling anything.
Deposit
Enter a new deposit amount and the sheet calculates how many shares, or how much dollar value, should go to each position.
This is useful when dollar cost averaging into the same target allocation.
Dividends
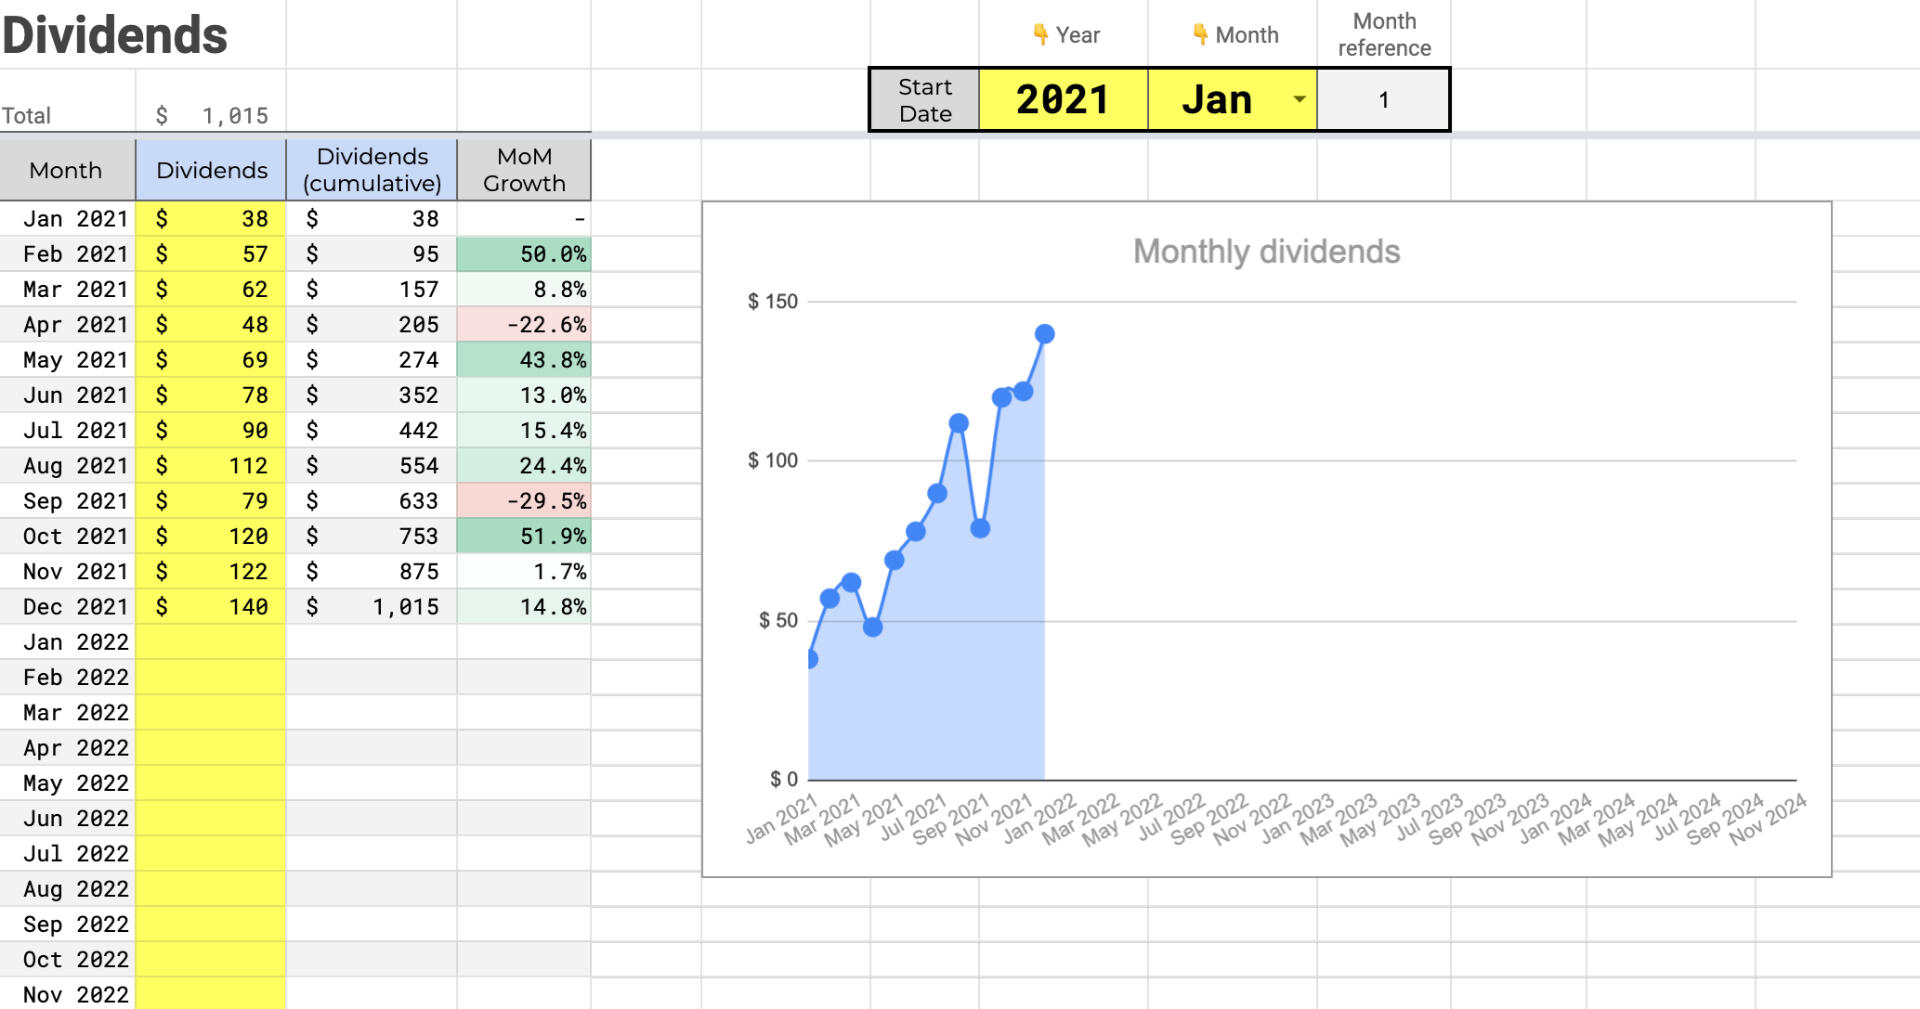
The Dividends tab tracks monthly passive income. Pick the year and month where you want to start, then enter dividend payments as they arrive.
The sheet shows month-over-month growth and a chart for the income trend.
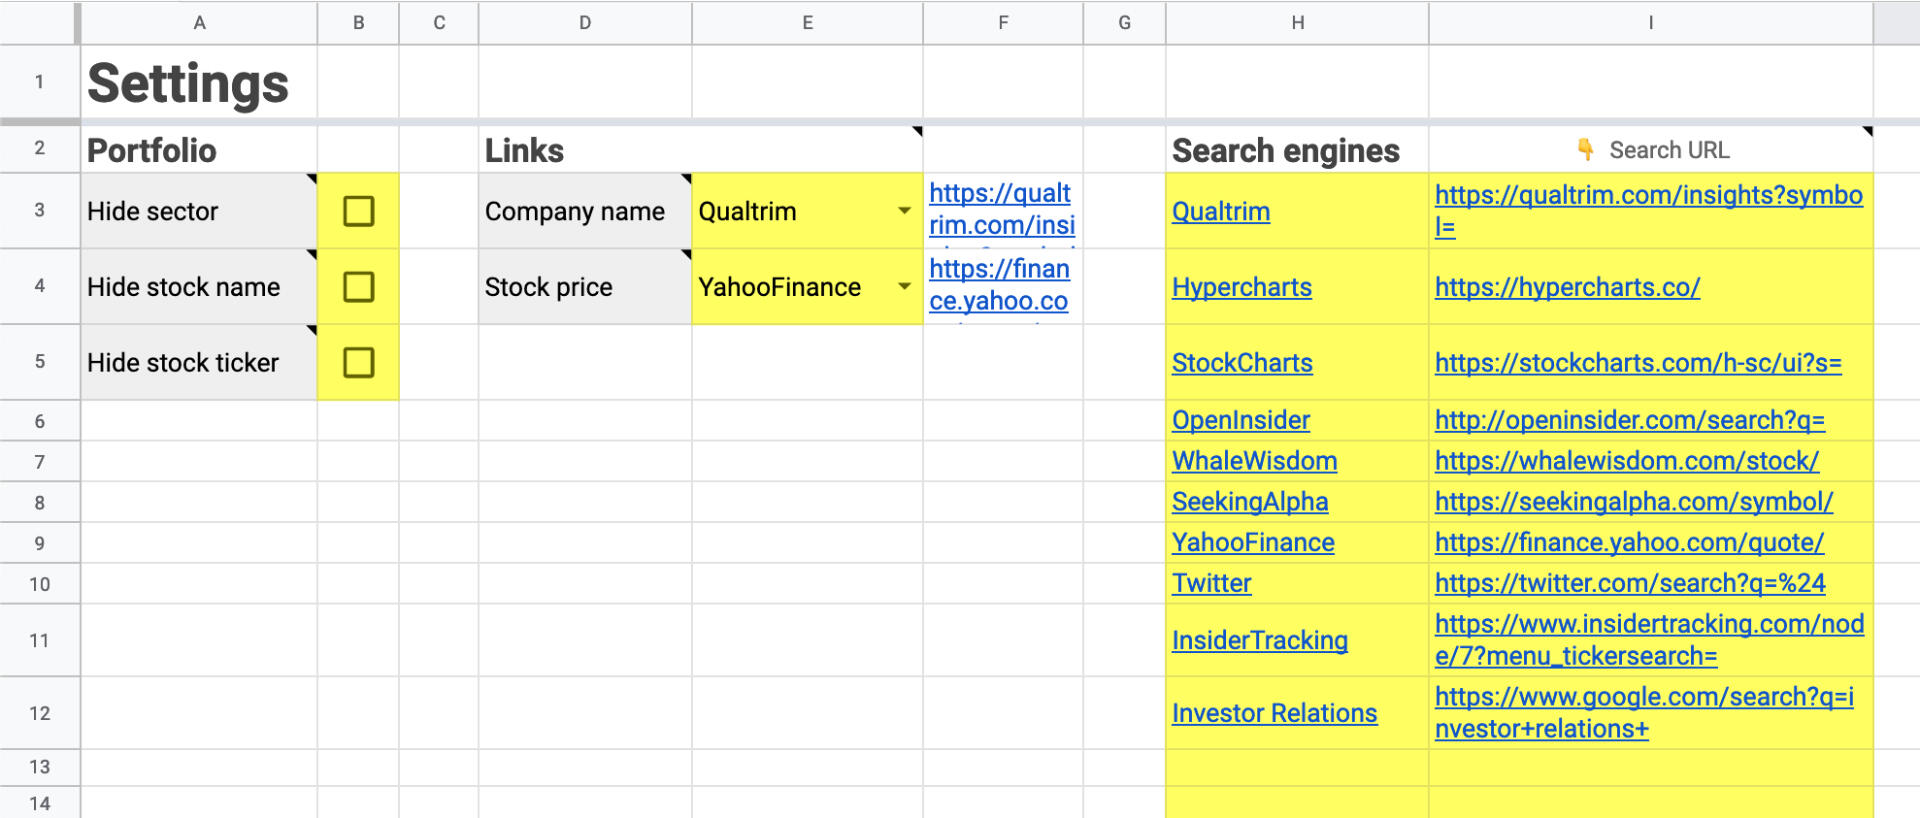
Settings
Settings control generated links, visible columns, and search engine options. See Settings for the full list.